Japan's 1989 bubble: the crash that ate an economy
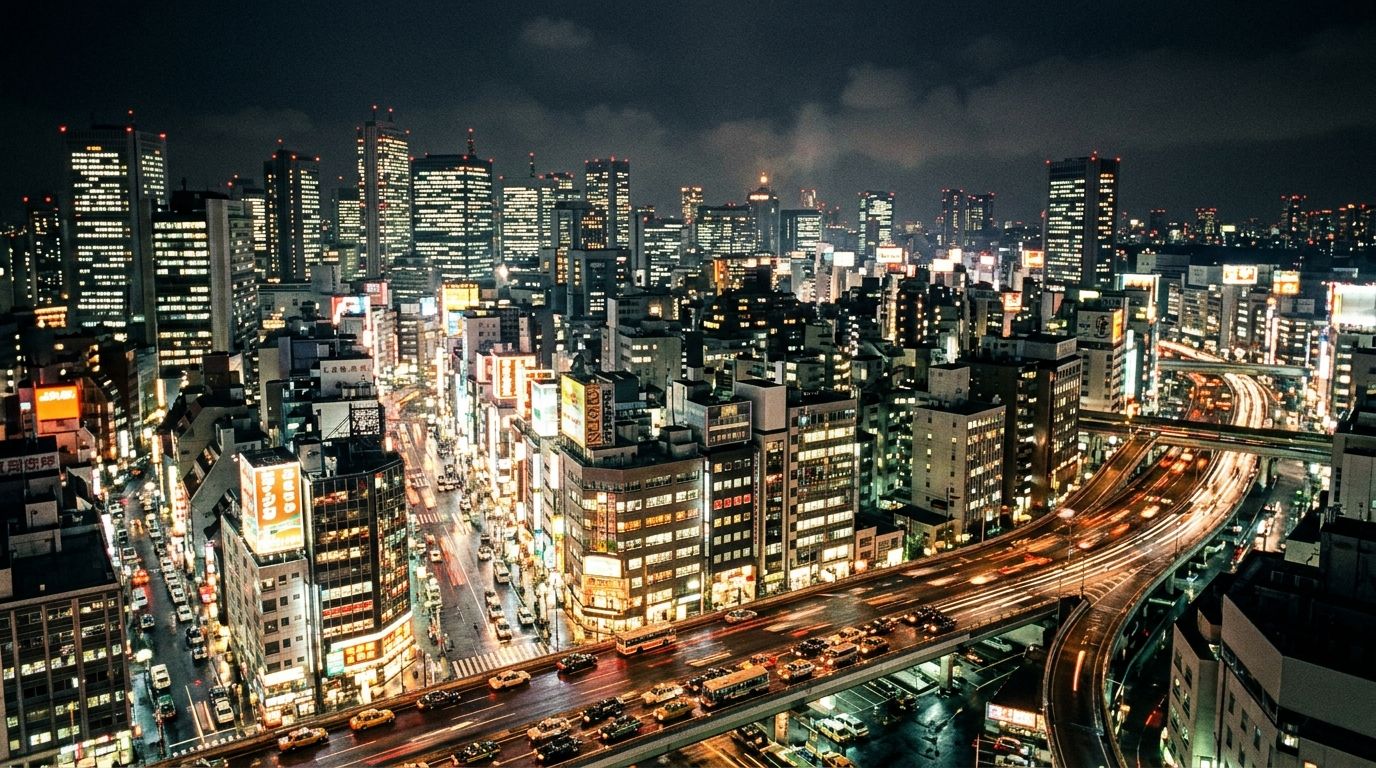
In the late 1980s Japan looked unstoppable. Cheap credit, soaring land prices and a euphoric stock market inflated one of history’s biggest financial bubbles, and the fallout lasted for decades.
In Brief
- The Nikkei 225 nearly tripled between the end of 1985 and the end of 1989, peaking at 38,915.
- The central bank raised rates five times in 15 months, from 2.5% to 6%.
- It took the index 34 years to beat its 1989 record; commercial land in six major cities fell 87% from its peak.
A strong yen, cheap money
Post-war Japan grew fast; between 1953 and 1965 the economy expanded by more than 9% a year. In 1980 it overtook the US as the world’s largest car producer.
The turning point was the 1985 Plaza Accord. With the decision to weaken the dollar, $1 went from 240 yen to around 120 yen by early 1988; the yen doubled in strength in three years, squeezing exporters.
The Bank of Japan cut its discount rate five times between January 1986 and February 1987, from 5% to 2.5%. The rate stayed there for two years and three months. Cheap credit flowed less into factories and more into shares and land.
Land as collateral, collateral as new debt
A belief that Japanese land was scarce and would always rise was widespread. Banks accepted land as collateral; rising land meant more borrowing, and more borrowing meant more buying.
Property loans from non-bank lenders rose from 22 trillion yen in 1985 to 80 trillion by the end of 1989. Tokyo land values jumped 58% in 1987 alone. In Ginza, a single square meter changed hands for 32 million yen, about $230,000.
Companies became stock market investors too. Running a share portfolio alongside the main business became common; banks held shares in the companies they lent to while also carrying their loans.
Expensive at the top, fast on the way down
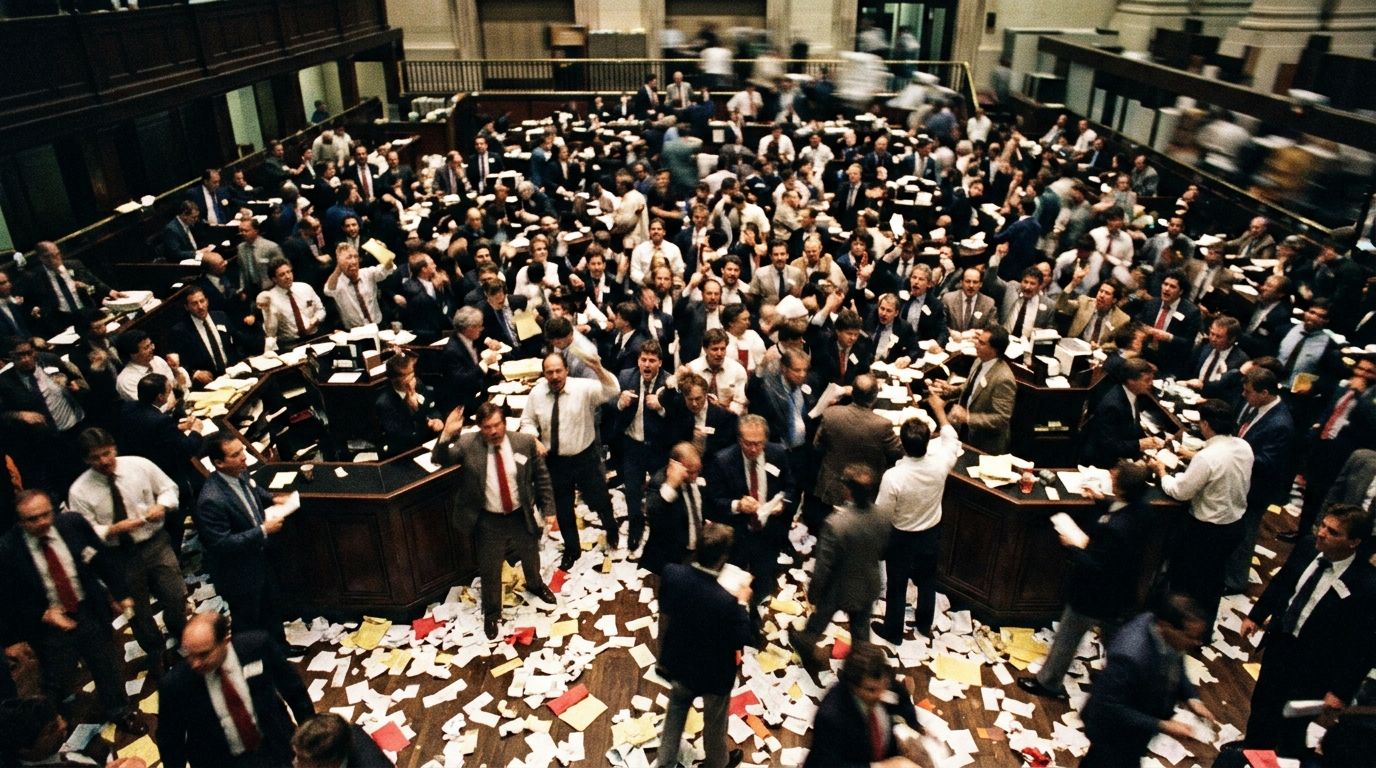
At the peak, Japanese stocks made up about 45% of global equity market value, versus roughly 33% for the US. Six of the ten largest listed companies were banks. The price-to-earnings ratio of Nikkei companies reached about 60.
The central bank started tightening in May 1989. The market set a record of 38,915 on 29 December 1989. By September 1990 the index had fallen almost 50% from its peak, and in the first year of the 1990s the market lost more than $2 trillion in value.
Zombie banks and lost decades
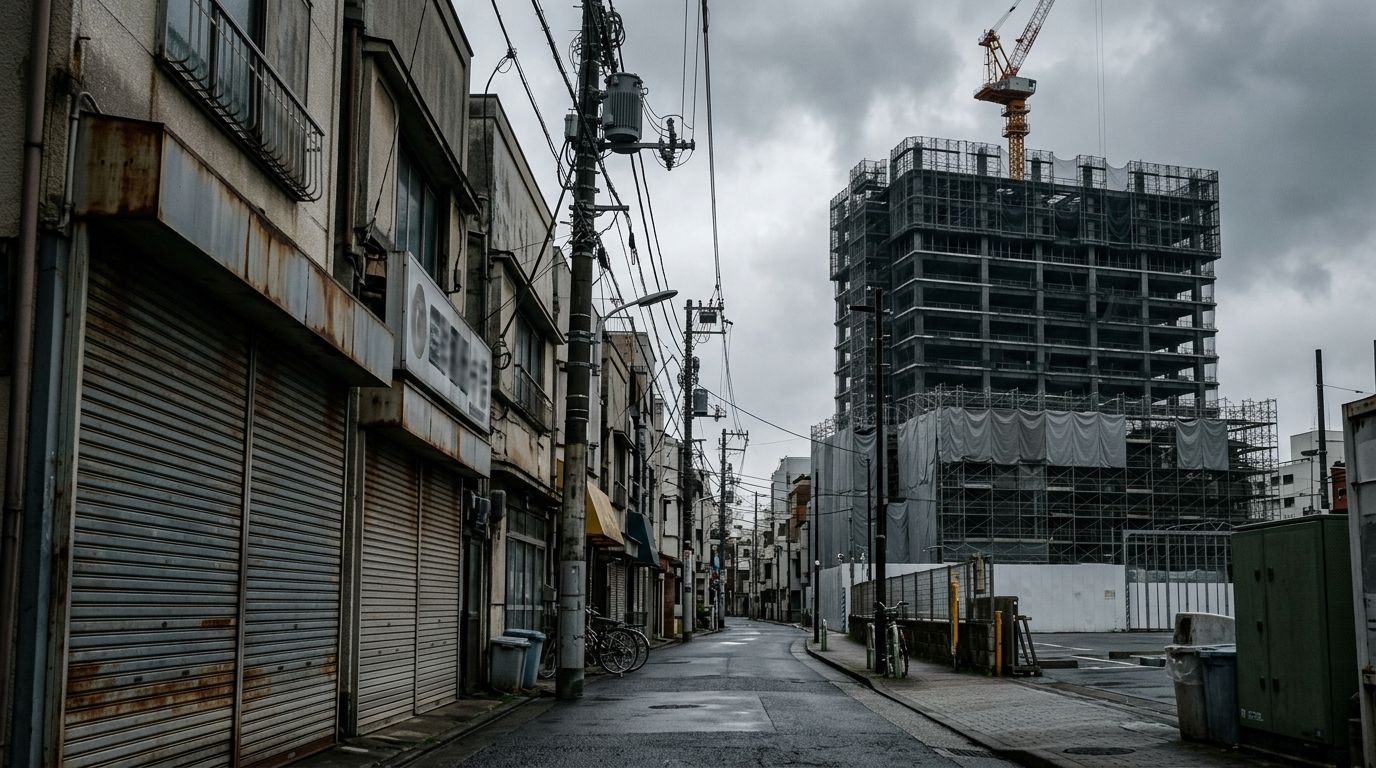
Land prices fell over years rather than months; a six-city index dropped to half its peak by 1995 and to a third by 2001. Borrowers whose collateral melted away were squeezed, and banks tightened lending.
Losses were not recognized quickly. Zombie banks, operating with wiped-out capital, kept zombie companies alive that survived only on that support. Firms used profits to repay debt instead of investing, a pattern known as a balance sheet recession.
In 1997 Hokkaido Takushoku Bank failed and Yamaichi Securities closed. The lost decade became lost decades: deflation took hold, young people struggled to find permanent jobs, and the economy went through three separate recessions in 12 years.
Key Assets
| Asset | Outlook | Why? | Key Level |
|---|---|---|---|
| Nikkei 225 | Negative | Took 34 years to beat its record | 38,915 (1989) |
| Tokyo land | Negative | Collateral value melted, credit tightened | 87% fall from peak |
| Japanese banks | Under pressure | Carried both loan and share losses | 1997 failures |
| Yen | Watching | Doubled in strength after Plaza | From 240 to 120 |
| Discount rate | Under pressure | Five hikes in 15 months popped the bubble | From 2.5% to 6% |
What to Watch
- Credit that grows on collateral tied to asset prices can reverse just as fast when prices fall.
- Raising rates quickly after keeping them low for long can trigger sharp drops in assets bought with debt.
- Recognizing losses late can stretch a crisis over years and weigh on growth and jobs for a long time.
This note was compiled from open-source data and content available online; it does not constitute investment advice.
This article is for general information only and is not investment advice.